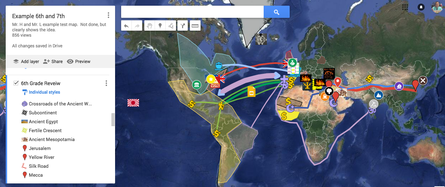
I have done a few posts on using my maps to visually record and document student learning.
You might want to check out those blogs before you read this one. Here I will only talk about the final product produced over two years. My Maps meets the new google earth Mapping out your curriculum: literally, map it out. |
The following interactive map was made by a seventh grader. They started the map in sixth grade and over the two years of social studies they added to the map. Explore it for a while and see how the layers work and what students where able to do. Each map (120) is individualized by each student. This is just one example.
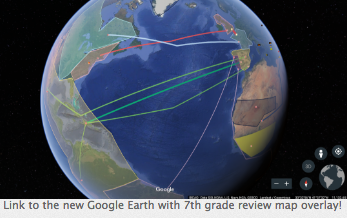
A few points about this my map. This file is saved in a students drive, so they can continue to build and layer as they move on in school (make an awesome electronic portfolio as a senior). They have added screencastify reflections to this map (helpful for me to see what they really are thinking about this software). They also begin to "See" connections between the content of 6th and 7th grade. Don't forget they can then export and upload to google earth to see all this information in a few different way. I am impressed by this and think it has a drastic effect on student learning.
0 Comments
Leave a Reply. |
Archives
July 2023
|